Data Visualization 2
Bora Jin
Today's Goal
- Explain continuous, discrete, and categorical variables
- Understand how to make visualizations and summarize variables according to their type
- Develop a faceted plot
Quiz
Q - (Numerical / Categorical) variables can be classified as either continuous or discrete.
Quiz
Q - (Numerical / Categorical) variables can be classified as either continuous or discrete.
Numerical
Quiz
Q - (Numerical / Categorical) variables can be classified as either continuous or discrete.
Numerical
Q - (Ordinal / Nominal) categorical variable has a natural ordering.
Quiz
Q - (Numerical / Categorical) variables can be classified as either continuous or discrete.
Numerical
Q - (Ordinal / Nominal) categorical variable has a natural ordering.
Ordinal
Quiz
Q - (Numerical / Categorical) variables can be classified as either continuous or discrete.
Numerical
Q - (Ordinal / Nominal) categorical variable has a natural ordering.
Ordinal
Q - Classify the following variables:
- monthly expenses
Quiz
Q - (Numerical / Categorical) variables can be classified as either continuous or discrete.
Numerical
Q - (Ordinal / Nominal) categorical variable has a natural ordering.
Ordinal
Q - Classify the following variables:
- monthly expenses: numeric, continuous
Quiz
Q - (Numerical / Categorical) variables can be classified as either continuous or discrete.
Numerical
Q - (Ordinal / Nominal) categorical variable has a natural ordering.
Ordinal
Q - Classify the following variables:
- monthly expenses: numeric, continuous
- number of shoes
Quiz
Q - (Numerical / Categorical) variables can be classified as either continuous or discrete.
Numerical
Q - (Ordinal / Nominal) categorical variable has a natural ordering.
Ordinal
Q - Classify the following variables:
- monthly expenses: numeric, continuous
- number of shoes: numeric, discrete
Quiz
Q - (Numerical / Categorical) variables can be classified as either continuous or discrete.
Numerical
Q - (Ordinal / Nominal) categorical variable has a natural ordering.
Ordinal
Q - Classify the following variables:
- monthly expenses: numeric, continuous
- number of shoes: numeric, discrete
- course satisfaction rating (“extremely dislike”, “dislike”, “neutral”, “like”, “extremely like”)
Quiz
Q - (Numerical / Categorical) variables can be classified as either continuous or discrete.
Numerical
Q - (Ordinal / Nominal) categorical variable has a natural ordering.
Ordinal
Q - Classify the following variables:
- monthly expenses: numeric, continuous
- number of shoes: numeric, discrete
- course satisfaction rating (“extremely dislike”, “dislike”, “neutral”, “like”, “extremely like”): categorical, ordinal
- eye color
Quiz
Q - (Numerical / Categorical) variables can be classified as either continuous or discrete.
Numerical
Q - (Ordinal / Nominal) categorical variable has a natural ordering.
Ordinal
Q - Classify the following variables:
- monthly expenses: numeric, continuous
- number of shoes: numeric, discrete
- course satisfaction rating (“extremely dislike”, “dislike”, “neutral”, “like”, “extremely like”): categorical, ordinal
- eye color: categorical, nominal
Quiz
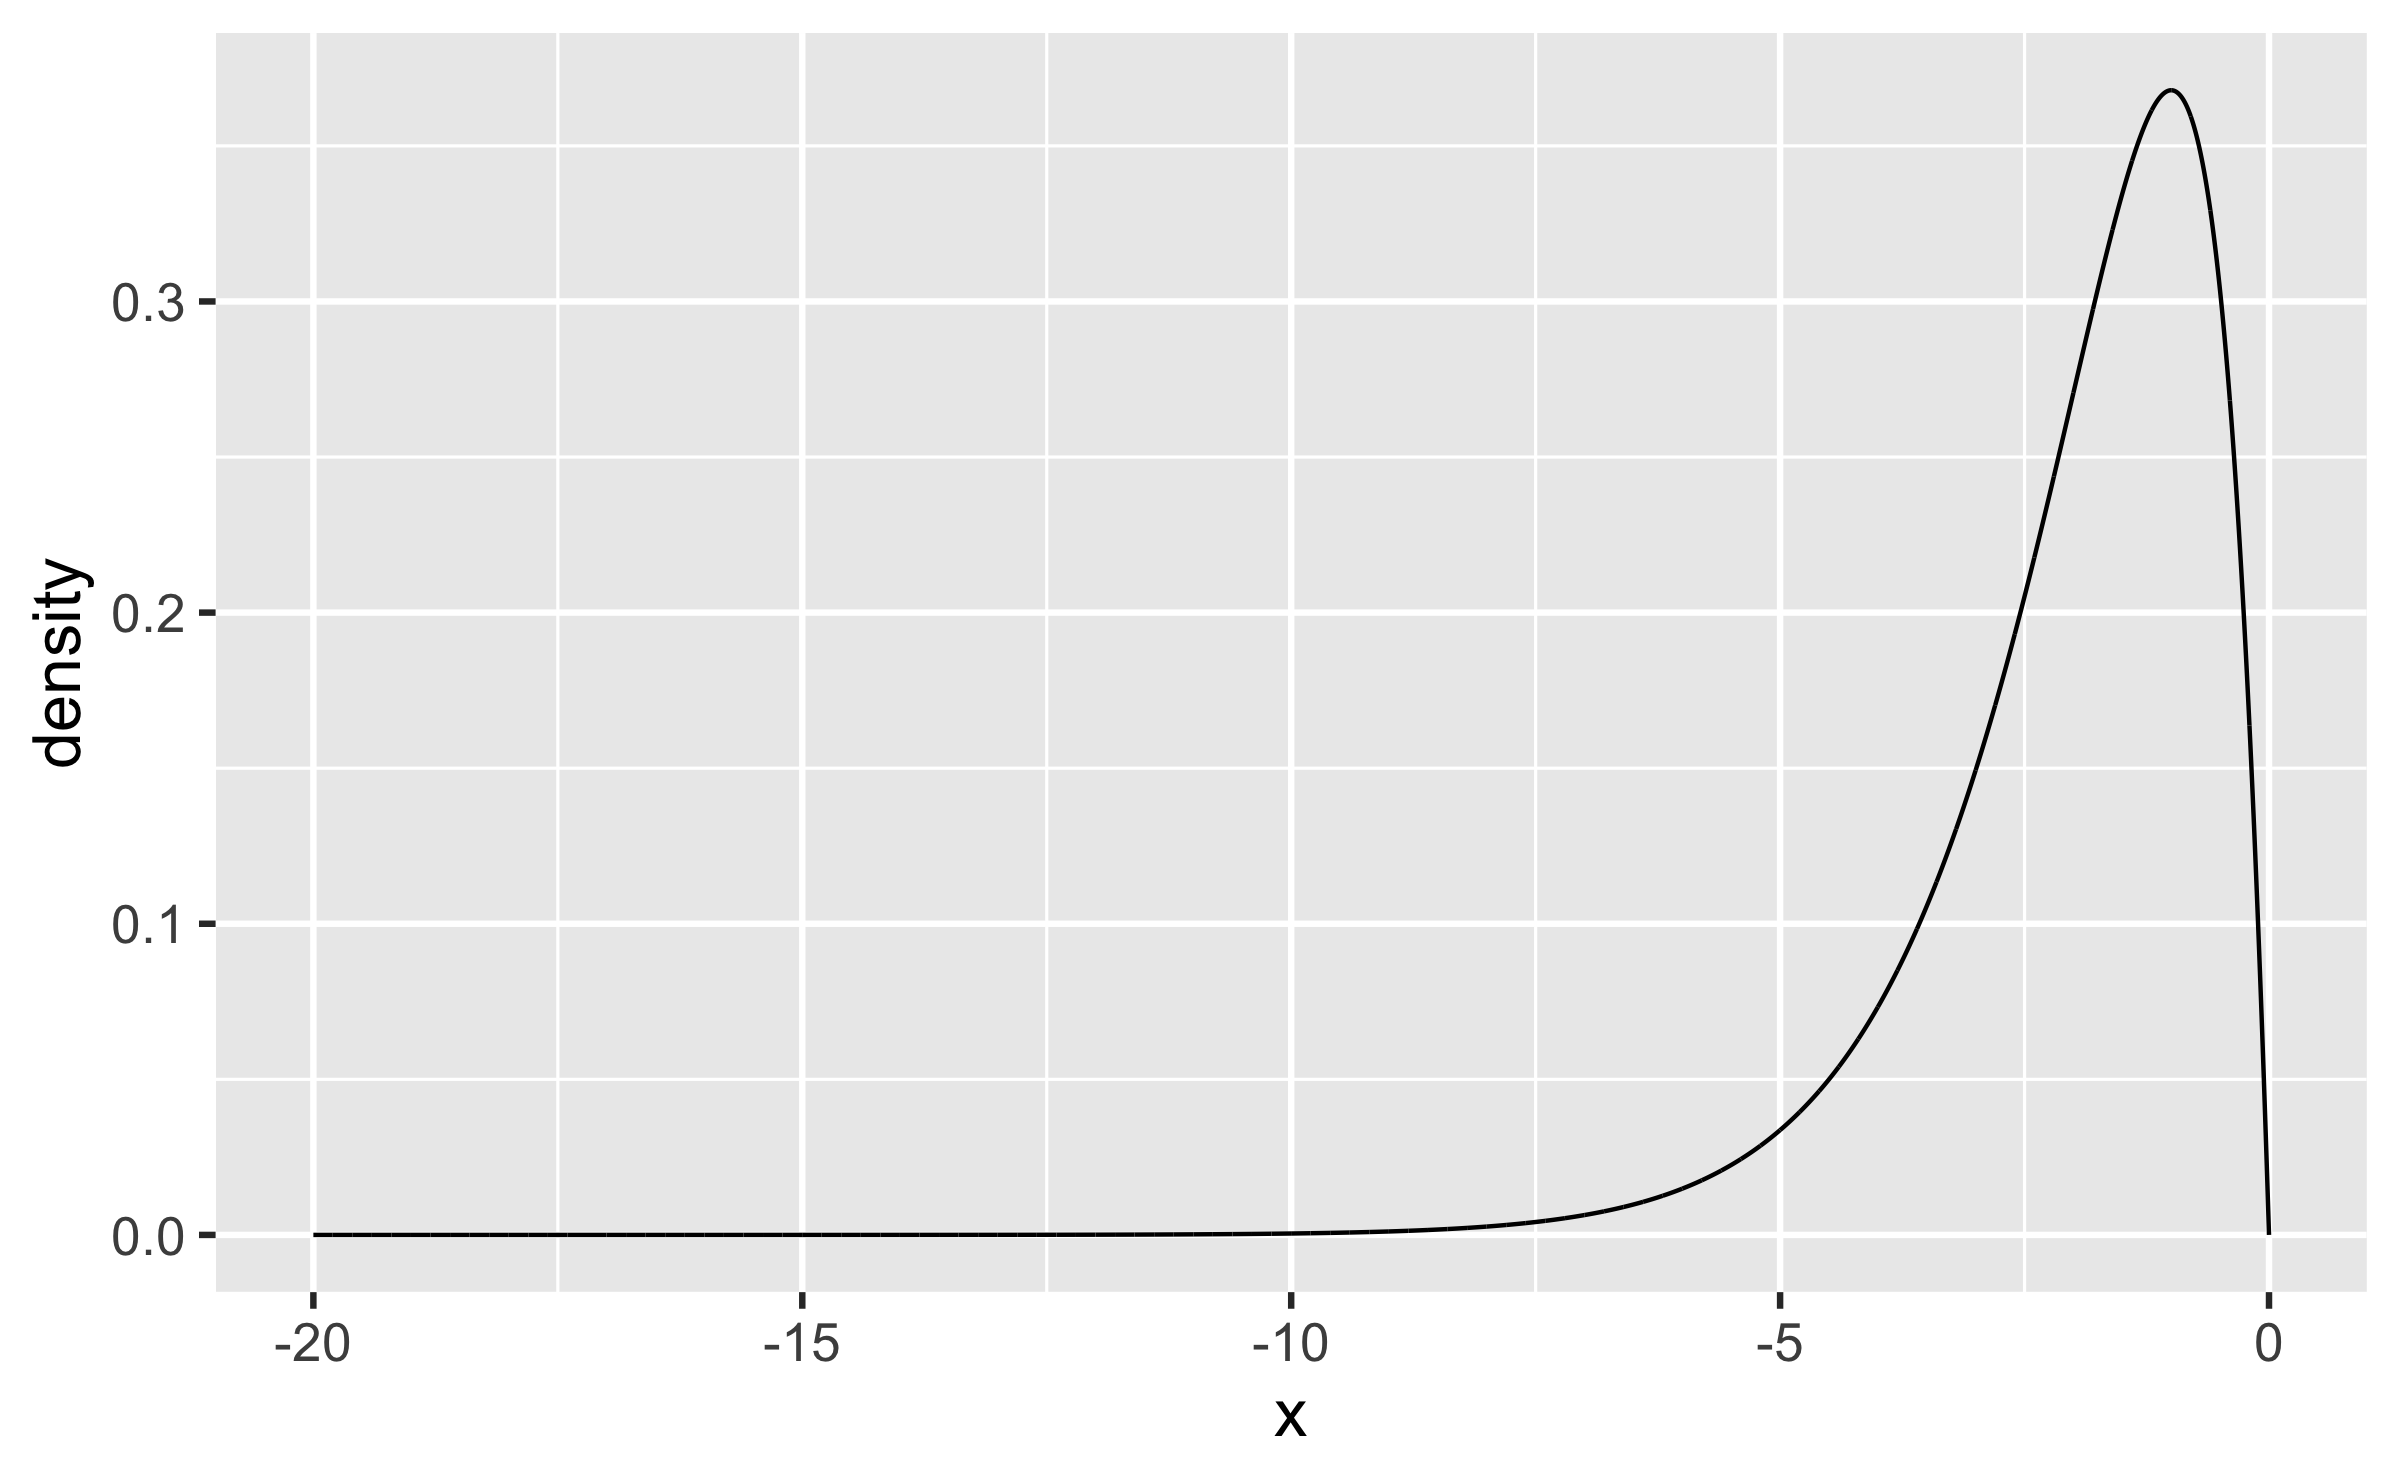
Q - Describe the shape of the following distribution of a numeric w.r.t. skewness and modality.
Quiz
Q - Describe the shape of the following distribution of a numeric w.r.t. skewness and modality.

left-skewed, unimodal
Quiz
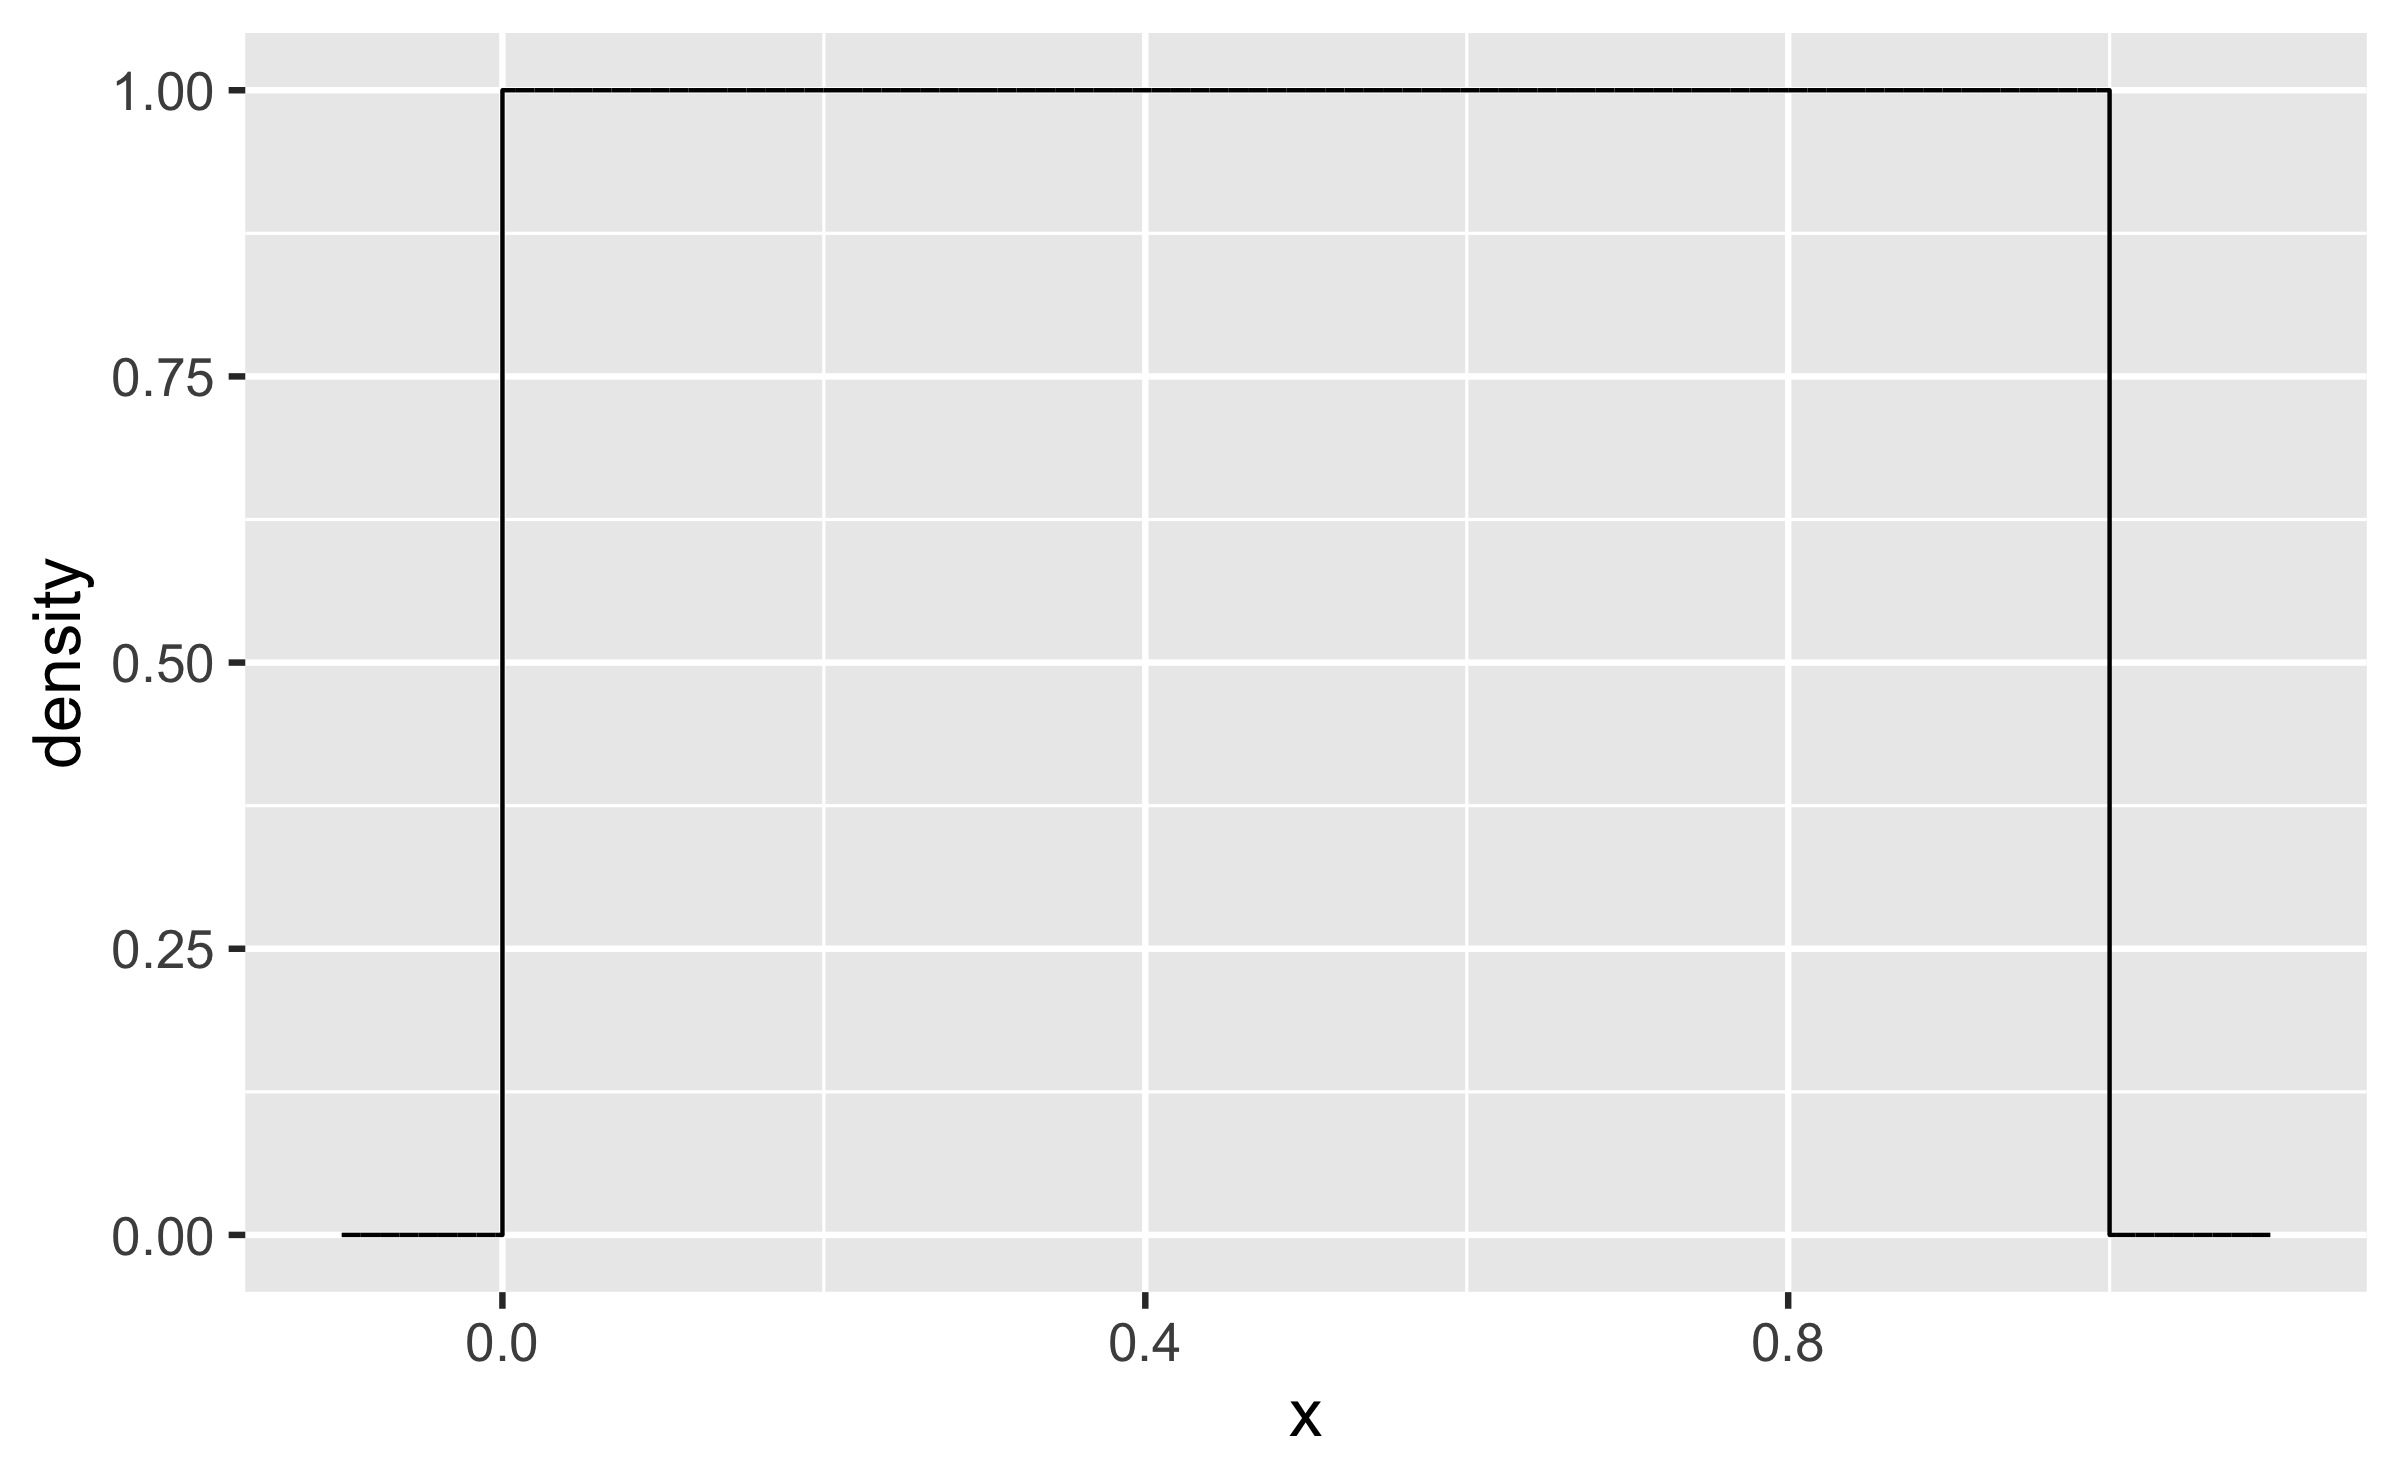
Q - Describe the shape of the following distribution of a numeric w.r.t. skewness and modality.
Quiz
Q - Describe the shape of the following distribution of a numeric w.r.t. skewness and modality.

symmetric, uniform
Quiz
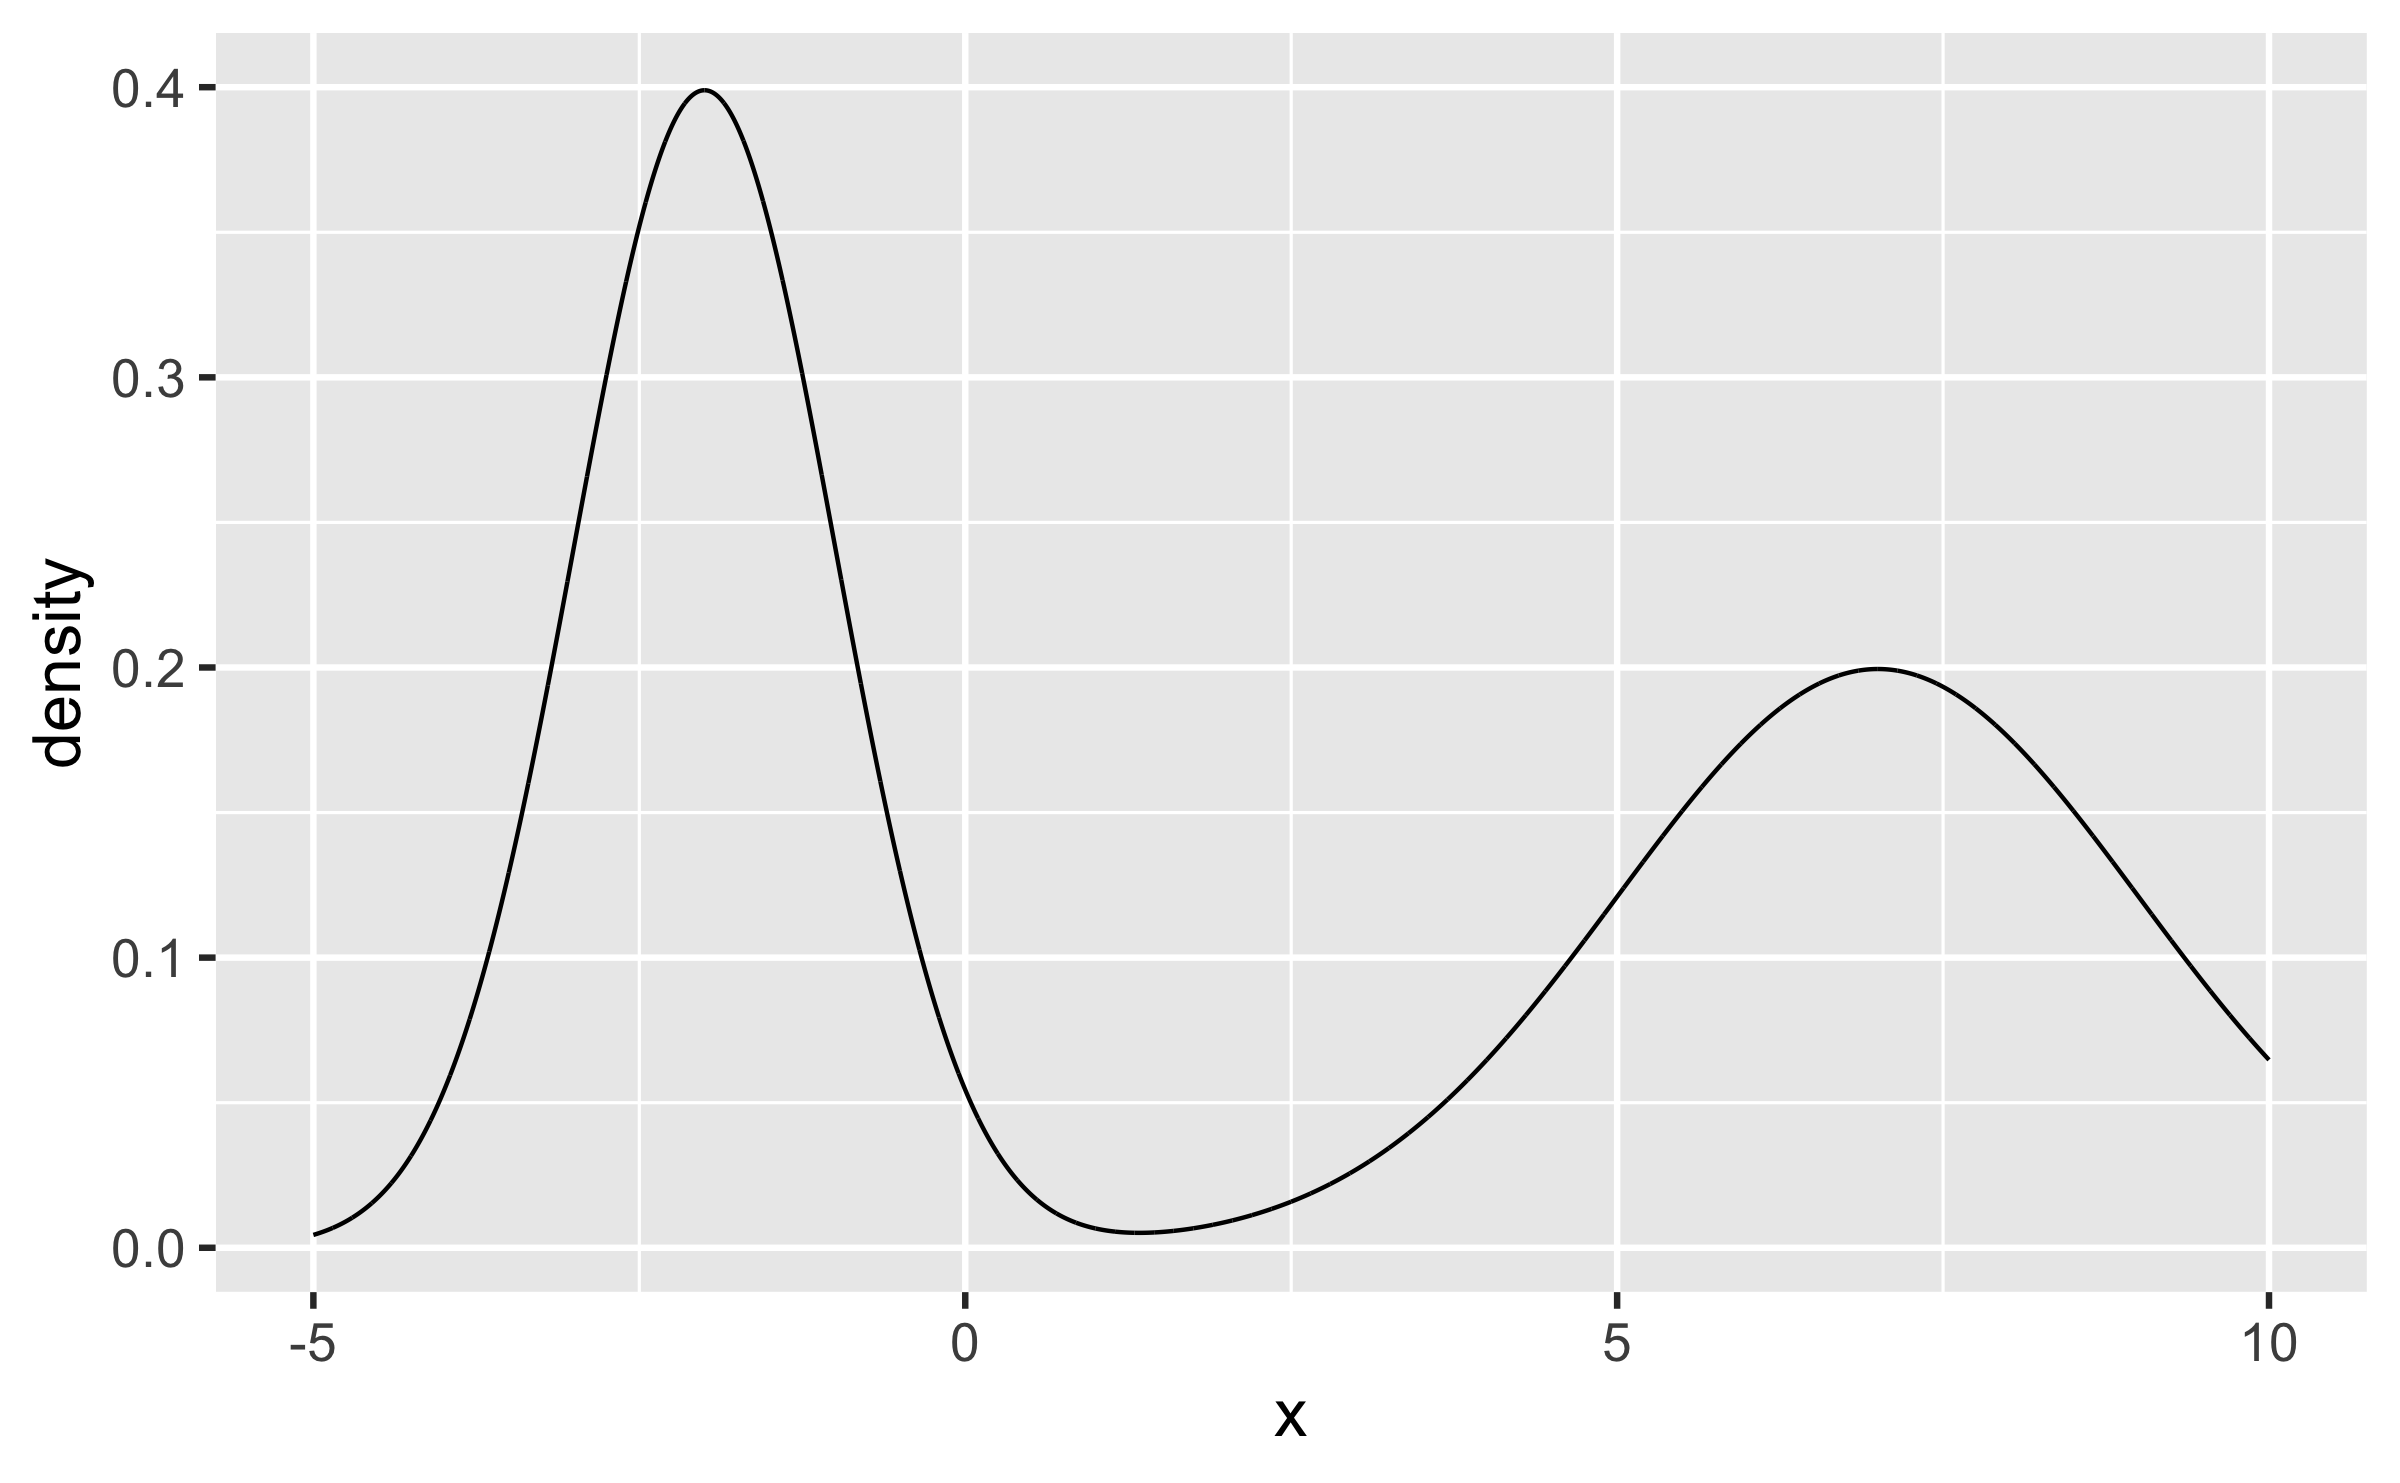
Q - Describe the shape of the following distribution of a numeric w.r.t. skewness and modality.
Quiz
Q - Describe the shape of the following distribution of a numeric w.r.t. skewness and modality.

bimodal
Quiz
Q - Fill in the blanks with appropriate R functions
- center: mean (
___), median (___) - spread: range (
range), standard deviation (___), interquartile range (IQR)
Quiz
Q - Fill in the blanks with appropriate R functions
- center: mean (
mean), median (median) - spread: range (
range), standard deviation (sd), interquartile range (IQR)
Quiz
Q - Fill in the blanks with appropriate R functions
- center: mean (
mean), median (median) - spread: range (
range), standard deviation (sd), interquartile range (IQR)
Q - What plot might you draw if you want to detect potential outliers?
Quiz
Q - Fill in the blanks with appropriate R functions
- center: mean (
mean), median (median) - spread: range (
range), standard deviation (sd), interquartile range (IQR)
Q - What plot might you draw if you want to detect potential outliers?
Box plot
Quiz
Q - Which of these commands are inappropriate to visualize distribution of a single numerical variable?
a. geom_histogram()
b. geom_point()
c. geom_density()
d. geom_boxplot()
e. geom_hex()
Quiz
Q - Which of these commands are inappropriate to visualize distribution of a single numerical variable?
a. geom_histogram()
b. geom_point() - to visualize relationships between two numerical variables
c. geom_density()
d. geom_boxplot()
e. geom_hex() - relationships between two numerical variables through binning
Quiz
Q - Which of these commands are inappropriate to visualize relationships between numerical and categorical variables?
a. geom_boxplot()
b. geom_violin()
c. geom_density_ridges()
d. geom_bar()
Quiz
Q - Which of these commands are inappropriate to visualize relationships between numerical and categorical variables?
a. geom_boxplot()
b. geom_violin()
c. geom_density_ridges()
d. geom_bar() - visualize distribution of a categorical variable or relationship between categorical variables
Quiz
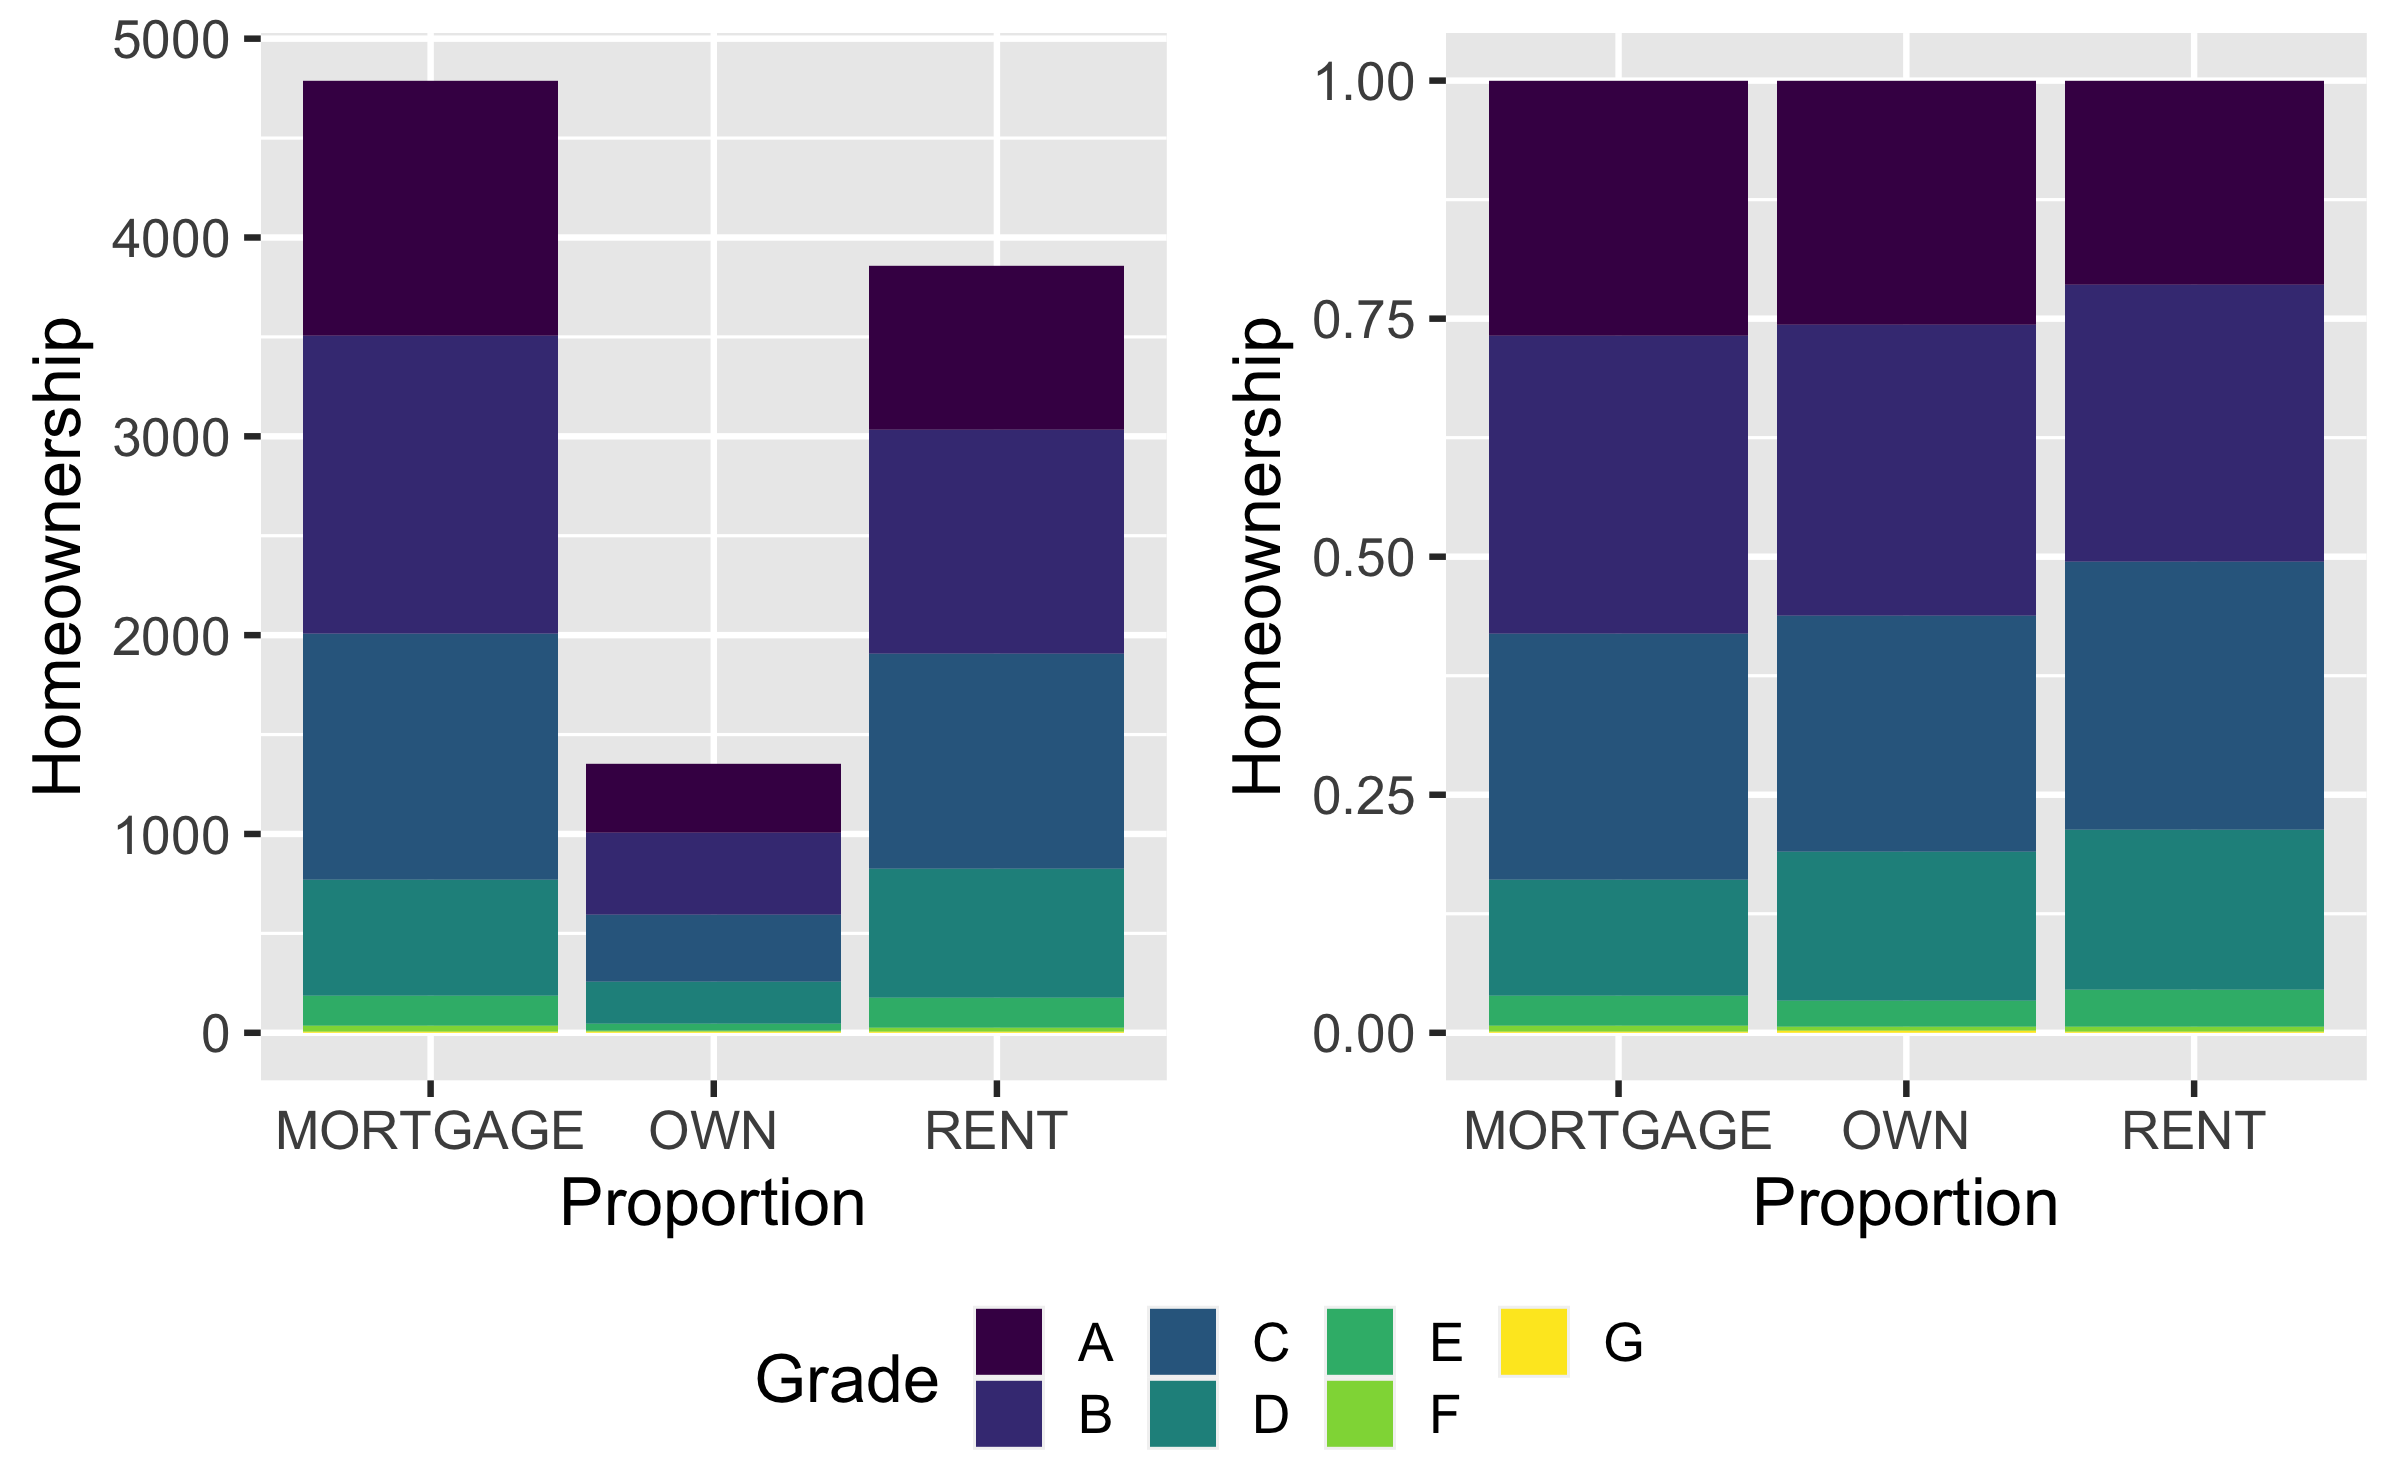
Q - Which of these is the most relevant for the difference between two bar plots?
a. aes(x = homeownership, fill = grade)
b. position = "fill"
c. labs()
Quiz
Q - Which of these is the most relevant for the difference between two bar plots?
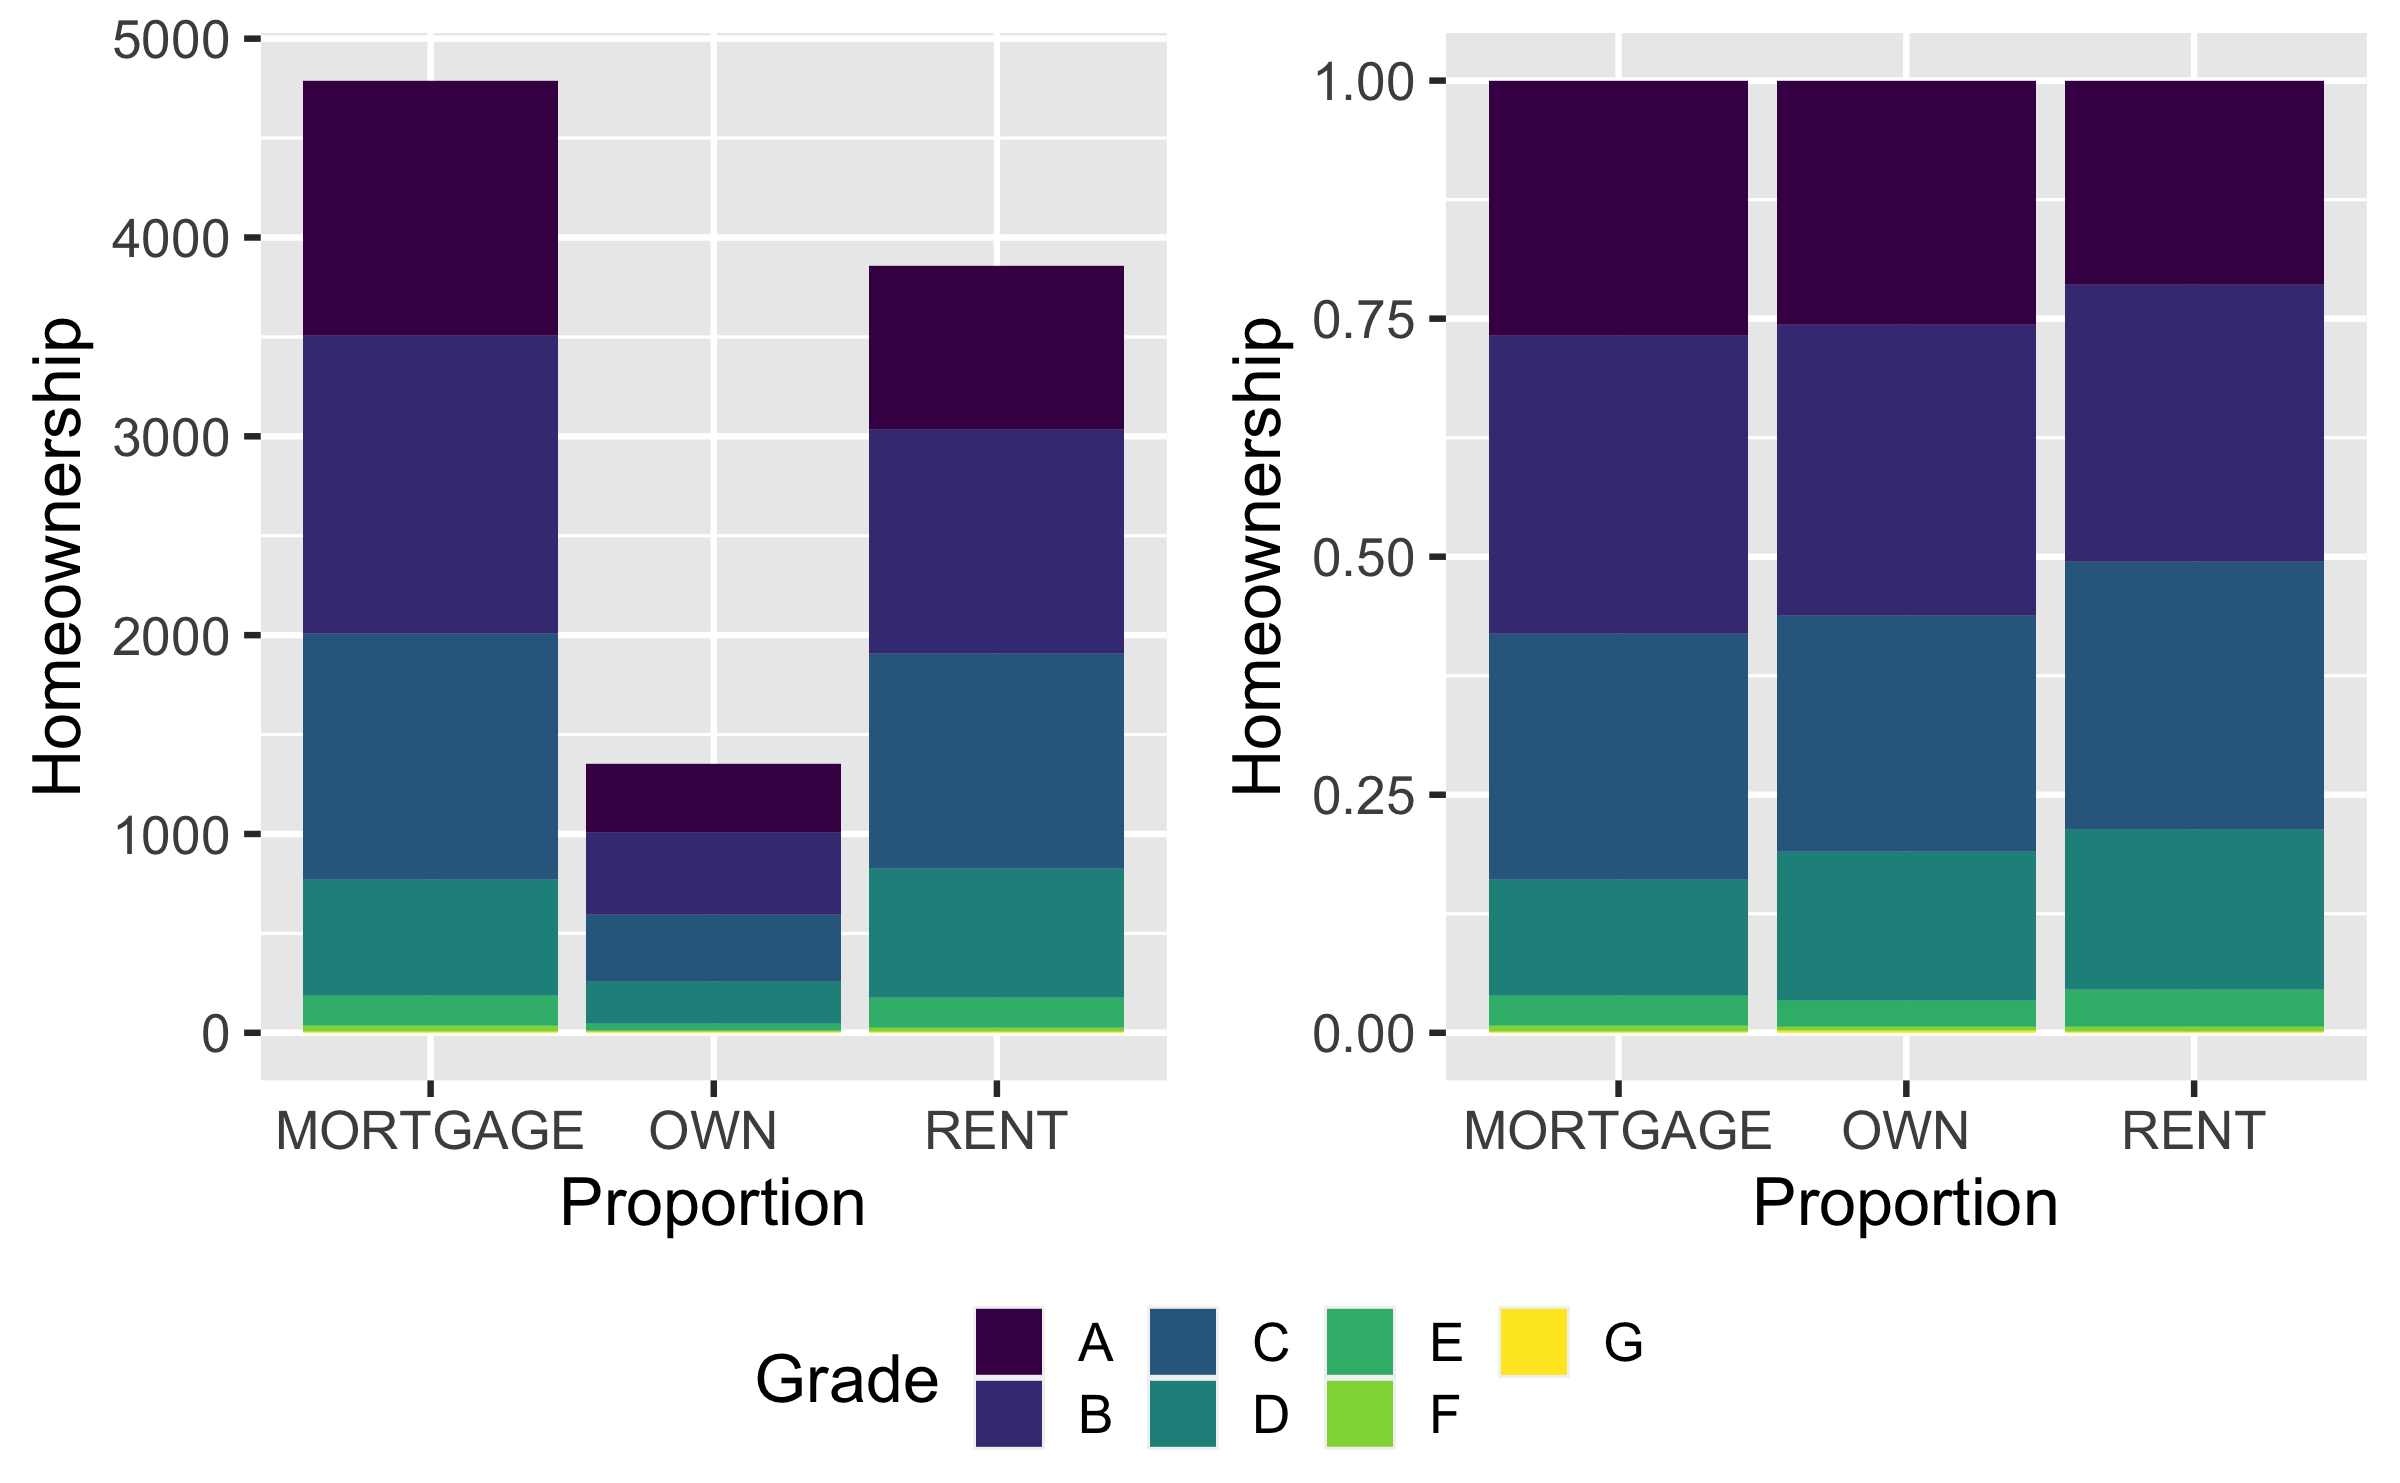
a. aes(x = homeownership, fill = grade)
b. position = "fill" - relative frequency within x
c. labs()
Bulletin
Lab 01 due Today at 11:59pm
Watch videos for Prepare: May 17
Complete Part 4 and Practice of
ae03Complete Part 1-2 of
ae04